hotel-data-viz
Hotel Data Viz
Animated data stories about travel and the hotel industry: long-run public data, drawn month by month, with the moments that matter called out along the way.
Each chart is one self-contained HTML page served straight from this repository by GitHub Pages. No server, no build step, no database. Open the link, or clone the repo and open the file, and you get the same thing offline.
Treasury yields and lodging construction, 1970–2026
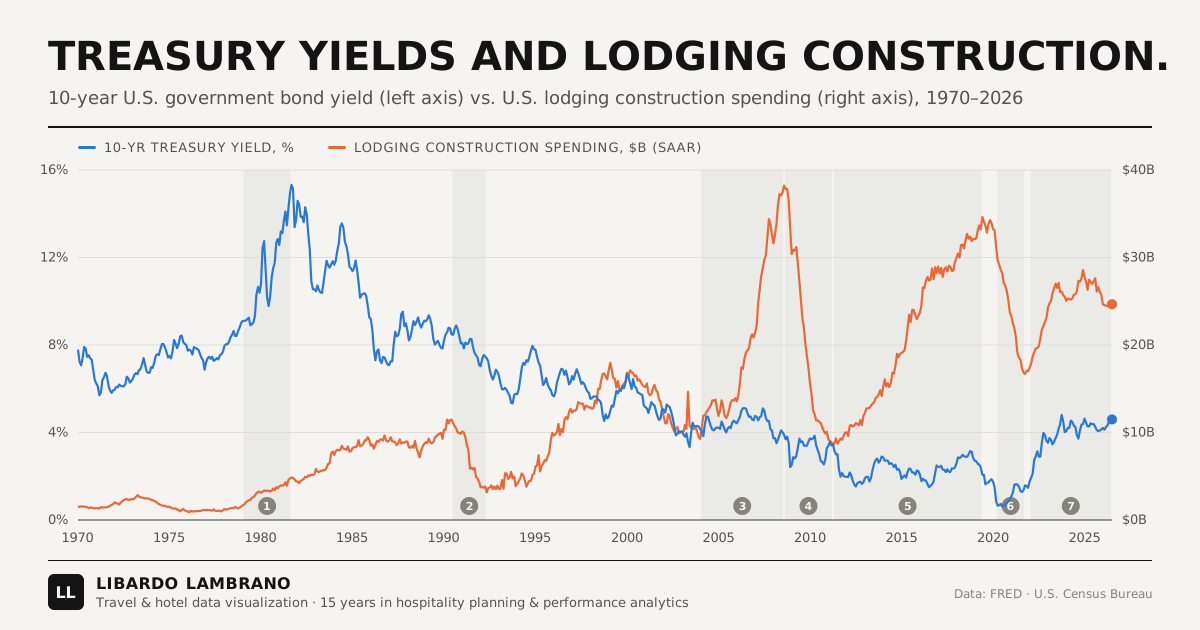
How much do interest rates drive hotel development? The chart animates 56 years of U.S. lodging construction spending against the 10-year Treasury yield and pauses on seven moments that answer the question:
| # | Period | What happened |
|---|---|---|
| 1 | 1979–81 | Rates hit 15%. Hotels kept building. Spending rose from $1.7B to $4.9B as tax incentives and easy savings-and-loan credit outweighed the cost of money. |
| 2 | 1990–92 | The bust. Spending fell 72%, from $11.5B to $3.2B, even as the yield eased. The 1986 tax reform and the savings-and-loan crisis cut off lending. |
| 3 | 2004–08 | Easy credit, record boom. Spending quadrupled to an all-time high of $38.2B with the yield between 3.5% and 5%. |
| 4 | 2008–11 | Credit freeze. Spending fell 77% to $8.6B while the yield dropped to about 3.5%. |
| 5 | 2011–19 | Cheap money, open credit. With the yield between 1.5% and 3.2%, spending climbed from $8.6B to $34.6B. |
| 6 | 2020–21 | Not a rate story. The yield hit a record low of 0.62%, yet spending was cut in half to $16.7B as the pandemic stopped travel. |
| 7 | 2022–26 | Rate shock, delayed impact. The yield rose from 1.8% to 4.8%. Spending kept rising to $28.6B through December 2024, then slipped to $24.7B by July 2026. |
The takeaway: rates set the price of money; lenders decide who gets it. Hotel construction responds to both, and it responds one to two years late, because projects take years to plan, finance and build.
Using it
- Play, Pause and Restart, a speed control and a timeline you can drag to any month.
- Story mode pauses on each moment with a short card. The key moments list below the chart jumps straight to one.
- Recording mode hides the buttons on the story cards so a screen recording plays through untouched. Open
#recordto start with it on. - Hover the chart while paused to read any month. The data table under the chart lists all 679 months.
Data
| Series | Source | Notes |
|---|---|---|
| 10-year yield | FRED IRLTLT01USM156N (OECD) |
Monthly average, percent |
| Lodging construction, 2002 on | FRED TLLODGCONS (U.S. Census Bureau) |
Total construction spending on lodging, seasonally adjusted annual rate |
| Lodging construction, 1970–2001 | U.S. Census Bureau, Value of Construction Put in Place, old classification: “Hotels, motels” | Private construction, seasonally adjusted annual rate; discontinued in 2003 |
The two lodging series are joined without adjustment at January 2002, and the chart marks the join. In 2002, the only year Census published both, the new series ran about 5% above the old one. One month in the published series, May 2003 ($14.7B, between months of about $10.5B), is a one-off spike and is left as published.
Notes on how it is built
- The axes grow with the data. The time axis and both value axes start tight and expand as the lines reach new ground, easing into place rather than jumping.
- Two y-axes, on purpose. A yield and a dollar amount can’t share a scale. Each axis carries its line’s colour key, and the page says plainly that where the lines cross means nothing.
- Every number in the story cards comes from the chart’s own data, and each card stays up long enough to read: about 300 ms per word, never under 10 seconds.
- Drawn on a canvas with no libraries. It respects reduced-motion settings and works at phone width.
What’s in here
yield-lodging/index.html            the chart: data, styles and animation in one file
images/yield-lodging-preview.svg    the preview above
Contact
Libardo Lambrano: travel and hotel data visualization, with 15 years in hospitality planning and performance analytics.